- News & information
- About
- History
- George V. Voinovich
- George V. Voinovich Collection
- Calendar
- How to Find Us
- News
- Archives
- Photojournalism Fellowship Project
- Photo Essays
- Current Fellow
- Previous Fellows
- Reports and Publications
- Archives
- Students
- Prospective
- Center for Entrepreneurship
- Environmental Studies
- HTC/Voinovich School Scholars
- Master of Public Administration
- Current
- HTC/Voinovich School Scholars
- Center for Entrepreneurship
- Environmental Studies
- Master of Public Administration
- Alumni
- Contact
- School Leadership
- Strategic Partners Alliance
- Ohio University Public Affairs Advisory Committee
- Ohio University Public Affairs Advisory Committee
- Faculty and Fellows
- Faculty
- Visiting Professors
- Voinovich Fellows
- Professional Staff
James
Dyer
Professor of Geography

Water Balance
Toolbox (v.1) for ArcGIS
This page
is no longer maintained.
Version 3
of the Water Balance is now
available.
Professor of Geography

Water Balance
Toolbox (v.1) for ArcGIS
This page
is no longer maintained.
Version 3
of the Water Balance is now
available.
 |
 |
|
|---|---|---|
|
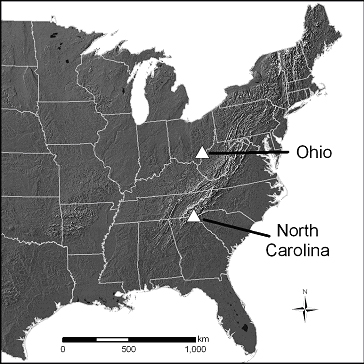
Location of the Ohio and
North Carolina
study areas in the eastern United States. |
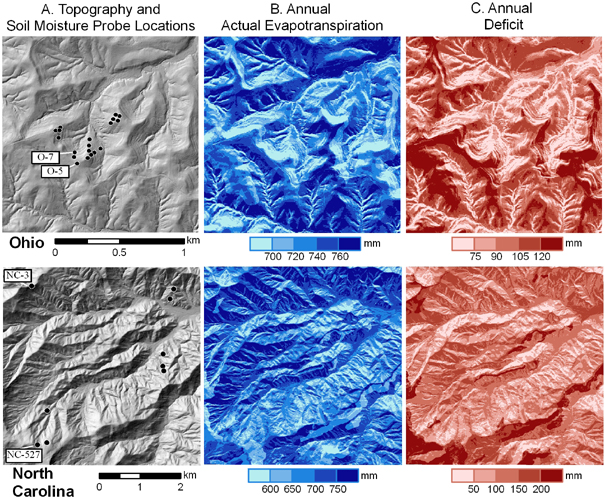
Ohio and North Carolina
study areas, showing A) topography and
location of soil moisture probes
Note the topographic pattern of (A) reflected in the
maps of AET and deficit(note difference in
scale between the two study areas),
B) Annual actual evapotranspiration, andC) Annual deficit. |
Citation:
Dyer, J.M. 2009. Assessing topographic patterns in moisture use and stress using a water balance approach, Landscape Ecolo gy 24: 391-403 .
As described in this paper, the water balance tool computes potential evapotranspiration using the Turc method for humid climates. If relative humidity is <50%, the adjusted Turc equation (with relative humidity term) would be more appropriate. To adjust PET for semi-arid and arid climates, multiply monthly PET grids by [1+((50-RH)/70)], where RH is the average monthly relative humidity value. The toolbox then computes soil moisture storage, actual evapotranspiration, soil moisture deficit, and soil moisture surplus for every grid cell within a DEM, using the Thornthwaite-Mather approach.
Note: one addition to the original
Water Balance model is the inclusion of an alternate
Storage routine ( X: alternative Storage Model (beta
version)
). This is a modification by Biswajit
Mukhopadhyay who added the PHI parameter to the original
Storage module. I include the model as an optional
"beta version" for users who wish to experiment with
it. (It would be used in place of the original A:
Storage
routine.)
User Manual
for
the Water Balance Toolbox [ Revised
August 2010, to include note about aligning all input grids
]
in PDF format (click here if you need to download the Acrobat Reader.)
Water Balance Toolbox - Demo Version (98 MB)
Zipped toolbox (Water Balance.tbx) developed for ArcGIS (v.9.2) PLUS sample grids to run the model. Zipped with complete folder structure for executing the model.
Update [May 2010]: Temperature grids for months 04 & 09, and the Precipitation grid for month 10 were originally integer format; these have been converted to floating point. (Precipitation for month 10 is zero -- this is not an error.)
Water Balance Toolbox (175 KB)
Zipped toolbox (Water Balance.tbx) developed for ArcGIS (v.9.2), without sample grids or folders.
Guidelines for Computing Monthly Radiation Grids Using the Solar Radiation Toolset in ArcGIS
in PDF format (click here if you need to download the Acrobat Reader.)
If you use
this model in your research, please acknowledge the source and
cite the original publication (above). The model is
distributed "as-is" but I welcome any suggestions, corrections, or
comments:
dyer@ohio.edu
in PDF format (click here if you need to download the Acrobat Reader.)
Water Balance Toolbox - Demo Version (98 MB)
Zipped toolbox (Water Balance.tbx) developed for ArcGIS (v.9.2) PLUS sample grids to run the model. Zipped with complete folder structure for executing the model.
Update [May 2010]: Temperature grids for months 04 & 09, and the Precipitation grid for month 10 were originally integer format; these have been converted to floating point. (Precipitation for month 10 is zero -- this is not an error.)
Water Balance Toolbox (175 KB)
Zipped toolbox (Water Balance.tbx) developed for ArcGIS (v.9.2), without sample grids or folders.
Guidelines for Computing Monthly Radiation Grids Using the Solar Radiation Toolset in ArcGIS
in PDF format (click here if you need to download the Acrobat Reader.)
Additional Information:
Data needs for performing a water balance using GIS are few: a digital elevation model (DEM), soil available water capacity (AWC), and monthly temperature, precipitation, and solar radiation. Below are some potentially useful links for obtaining these data, along with some notes on their use.
Solar Radiation
The
National
Renewable Energy Laboratory provides solar radiation estimates
for the
at 10-km resolution.
URL: http://rredc.nrel.gov/solar/old_data/nsrdb/1991-2005/
The “readme” file for the SUNY 10-km gridded data contains information about file structure and organization. Global Horizontal Radiation data can be downloaded for a study area and used to parameterize the Diffuse Proportion (D) and Transmittivity (T) values in ArcGIS’s Solar Radiation Toolset. Since the SUNY 10-km gridded data are provided at hourly intervals, the global horizontal radiation values can be summed to provide a monthly total, which will be directly comparable to monthly estimates derived from the Solar Radiation Toolset. Refer to these Instructions for Processing SUNY Gridded Radiation [added August 2010] .
Available Water Capacity
In
the
, soil water-holding capacity is
available from digitized soil surveys from the Natural Resources
Conservation Service (1:12,000 to 1:63,360 mapping scales; the
“SSURGO” database).
URL: http://soildatamart.nrcs.usda.gov
The polygon shapefiles can be joined with available water capacity attributes (located in the "muaggatt" table in the accompanying .mdb database; the join will be based on the "mukey" field.) To perform water balance analysis, these polygon shapefiles can be converted to AWC grids. In ArcGIS, this would involve using ArcToolbox – Conversion Tools – To Raster – Polygon to Raster:
- Input = soils shapefile
- Value field = aws0100wta (Available Water Storage 0-100 cm – Weighted Average; other depths are available. AWS is expressed as centimeters of water.)
- Output = name _AWC_cm
- Cell Assignment Type = MAXIMUM_COMBINED_AREA
- Cellsize = same cellsize as the DEM you will use for the water balance analysis (can be cut-and-pasted from the DEM’s properties in ArcGIS)
The resulting grid will need to be
converted to millimeters. In ArcGIS, this would involve
using ArcToolbox – Spatial Analyst Tools – Math – Times.
- Input raster = name _AWC_cm
- Constant value = 10
- Output raster = soil_awc_mm
Digital Elevation Models
DEMs
are
available
for
many
locations
at
⅓-arc
second (~10 m) resolution (or finer) from the U.S. Geological
Survey’s National Elevation Dataset.
URL: http://seamless.usgs.gov/
The DEMs that you download will have elevation in meters, with a Geographic Coordinate System (NAD83) projection (units = degrees). Thus, the x, y, and z values will be in different units. You will need to reproject the grid to a "meter-based" projection (such as Plate Carree (world), or UTM). An easy way to accomplish this is to set the projection of the Data Layer that contains the DEM, then right-click on the DEM and select Data – Export Data. For Spatial Reference, select "Data Frame (Current)." The output raster should have square cells, and be in Grid format.
Climate
Monthly
temperature and precipitation grids
are available for the U.S. at
30-arc second (~800 m) resolution from the PRISM Group.
URL: http://www.prism.oregonstate.edu/
After downloading and unzipping the grid, change its extension to ".txt" You can then use ArcGIS's ArcToolbox – Conversion Tools – To Raster – ASCII to Raster. The new grid will be in Geographic Coordinate System - Spheroid-Based - GRS 80 ( ArcToolbox – Data Management Tools – Projections and Transformations – Define Projection).
Last updated 23 July 2017
Back to Main Page
Contact Information:
(740) 593–9381 | Building 21, The Ridges
Ohio University Contact Information:
Ohio University | Athens OH 45701 | 740.593.1000 ADA Compliance | © 2018 Ohio University . All rights reserved.
